
Weekly Market Missive
This Report is for the trading days beginning Wednesday, September 5, 2012, through Tuesday, September 11, 2012 (the report Period). For the Period the indices were up about 2%. The DOW and S&P were both up 2. 1% the mid caps rose 2. 3% and the small caps gained 3. 0% which was all before QE-3.
In the news for the week initial claims were 382,000 which was the third miss in a row. Producer prices were up 1. 7% in August on increasing prices for food and fuel. A day later the Consumer Price Index increased 0. 6% for August which is a significant increase for that metric. Consumer Credit dropped in August but Consumer Confidence spiked during the Democratic convention. Industrial Production dropped 1. 2% in August. The July trade deficit fell to $42 Bn in July. The U. S. budget deficit in August was $192 Bn and $1. 2 trillion fiscal year to date while the treasury sold $32 Bn in 3 year notes, $21 Bn in 10 year notes and $13 Bn in 30 year notes. August volume on the NYSE was 50% lower than last year and the markets closed at post 2007 highs.
And then there was QE-3. As you may recall we posted quotes from two former Fed Governors last week indicating that QE-3 would probably not be forthcoming. Early this week former Fed governor Mark Olson predicted a delay saying "The only possible impact it (QE-3) would have would be psychological. "Then former Fed governor Kevin Walsh indicated that QE-3 would not help employment saying "the iPhone5 will do more for the real economy than QE-3. "On the morning of the meeting Jim Rodgers said the Fed would not announce QE-3 because, "They'll look like fools" and then the Fed announced QE-3 saying it will buy $40 Bn a month in Mortgage Backed Securities and continue Operation Twist where they buy $45 Bn a month worth of Treasury securities as well as continue said buying through at least 2014 meaning that the fed's balance sheet will grow from $2. 9 trillion to approximately $4. 0 trillion by January 2014 when Chairman Bernanke's term expires. Needless to say many people, including us, were surprised to the point of being stunned by the magnitude of the announcement. To be complete the only informed opinion we saw that said it was to small was Paul Krugman.
The problem that most everyone sees is that neither QE-1 nor QE-2 materially improved organic growth because the distribution mechanism was through the banks and they refuse to lend. Since QE-3 uses the same mechanism we can assume similar results. Commenting on just this point one frustrated commentator said, "If the Fed was serious about reducing unemployment it would take some of that money and buy Small Business Administration bonds. "In sum, it is our conclusion that the policy is in direct opposition to the stated reasoning.
When faced with situations where stated reasons oppose actions we find it instructive to employ the methodology of evaluating the predictable consequences of the actions for possible evidence of intent. Informed consensus is that mortgage rates fall possibly below 2%. Equity prices inflate. Gold prices rise commensurate with or slightly faster than inflation. Oil prices increase to between $150 and $190 per barrel. Employment and organic economic growth remain stagnant to the degree they are not harmed by increased fuel costs. The major banks are flooded with cheap money and inflation /deflation are a guessing game with no clear outcome. Indeed, by the close of business the day after the QE-3 announcement gold was up ≈2%, oil up ≈2%, equity prices up ≈2% and mortgage rates were down to just 28 pips above the underlying treasury security interest rate. As to the possible intent we can only speculate that either the trading losses at the banks have weakened their positions to the point where they are in trouble - again, or some major policy action or event is being anticipated that will cause additional stress. Perhaps the looming fiscal cliff.
Nevertheless, our concentration in these reports is supposed to be on equities and in our opinion QE-3 will be roundly positive for equity prices particularly for oil concerns with the usual caveats which include geo-physical and geo-political risk.
For the Period price support in ABC shares was stellar with the shares up $X.XX per share or about YY.Y% to close the Period at $XX.XX per share. The clearing data indicated that the price action was driven by a large number of speculative day trades and position settling as the price broke the 200 DMA higher.
The clearing chart for the period was:
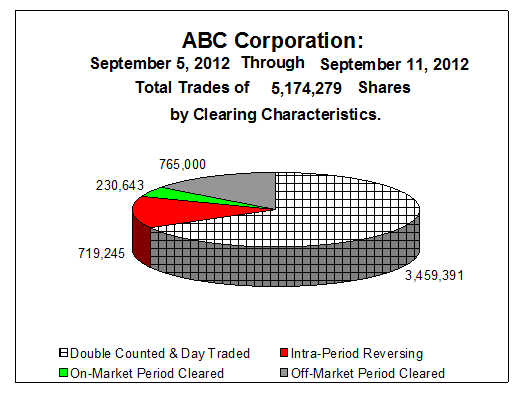
Showing just about 1 million shares of semi-permanent or permanent on-market trading out of 5. 2 million shares reported as traded with 765,000 shares of net-off market clearing. The off-market clearing was elevated by 580,000 shares because on the last day of the Period SAC borrowed 580,000 shares from Barclay's and we won't be able to see how that was delivered out until next week.
With the off-market activity filtered out the trading graph was:
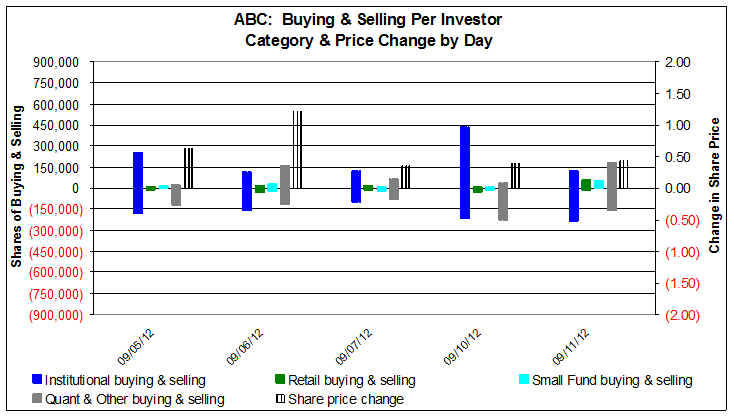
Showing that the move was on mostly institutional and quant trading as different interests positioned for QE-3 where ABC got the benefit of being in a preferred sector which is a credit to the IR messaging effort by keeping the concentration on the company's shift to the preferred sector.
The Net position changes for the Period greater than 50,000 shares were:
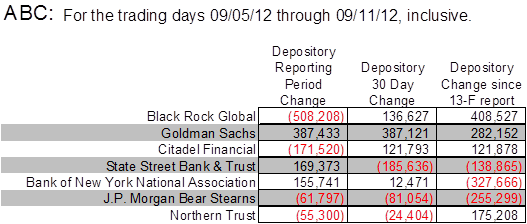
Which shows the net effects of the 580,000 share borrow by SAC from BlackRock with BlackRock receiving 90,000 shares of loan repayments exclusive of that borrow and SAC with 190,000 shares of other loan repayments from the borrowing. The largest on-market seller was Citadel who like us was convinced that the fed would not announce QE-3 and they were on the wrong side of the trade in a big way selling more than half their position. The addition at State Street is confusing as the modeling gives an equal probability of new state pool or other large buyer versus incremental additions by Nuveen, Lazard, Wells Capital and SSgA. Given that the net flow over 30 days and back to the end of June was negative we lean toward the incremental additions probability. The increase at Bank New York was 190,000 of share loan repayments to Dimensional Funds less selling by the same. The decrease at J. P. Morgan models as deliveries from collateral accounts on position closing which will be reported as a decrease by AQR. The diminution at Northern Trust was 64,000 shares of net share loans and buying by Northern Trust Investments proper and the diminution at Credit Suisse was net on position settling of 300,000 gross shares worth of positions which left this speculator with only 1,000 shares in their account also indicating that they did not expect QE-3.
In this connection we would hearken back to the press reports we reported on several weeks ago. In hindsight it's pretty clear that the play was a general market retrenchment on the lack of QE-3 with an intentional effort to increase the volatility in the sector to increase trading profits. As the result was the exact opposite on the surprise by the Fed this will show up at the end of the quarter in the prop desk trading activity mostly at Credit Suisse and we would expect a miss from that prop desk operation. And speaking of all this hanky panky, the short interest reports came in for September 1, 2012, and as of that date the reported short interest in ABC shares was XX,XXX,XXX shares which represented a small decrease from the YY,YYY,YYY shares reported the 15 days prior.
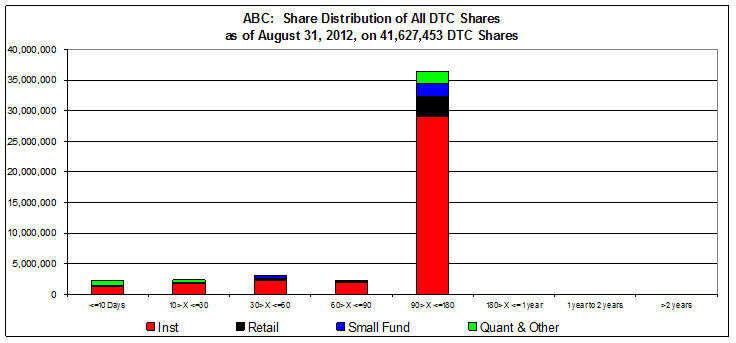
Also as we mentioned last week and in the supplemental report that we forwarded during the middle of the week, the baselines as of August 31, 2012, were calculated which serve as our base-lines going into the post Labor Day through Thanksgiving trading interval. Having presented the age price data as of August 28, 2012, last week we note that those numbers did not change much but in the interest of completeness the August 31, 2012, numbers are:
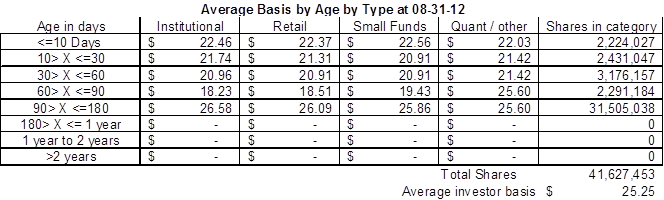
The overall changes in ABC's market composition during the term of our engagement have been:
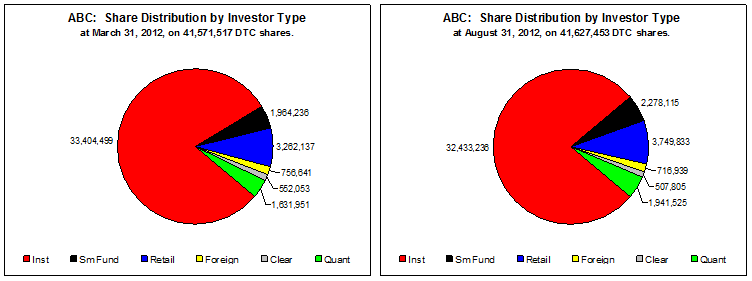
Showing that from March 31, 2012, through August 31, 2012, institutional participation decreased while small fund and retail investment increased significantly which is an indication of where the IR efforts are getting traction. The same information in a different format appears as:
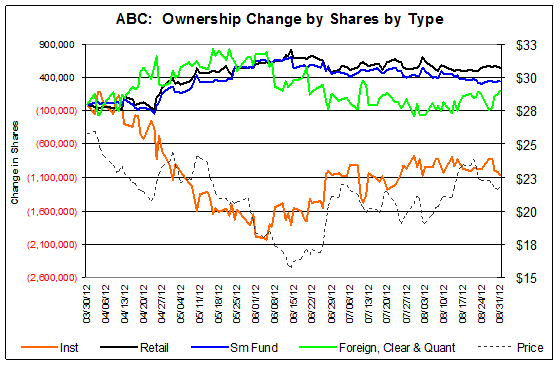
The trading metrics for ABC over the same time frame were:
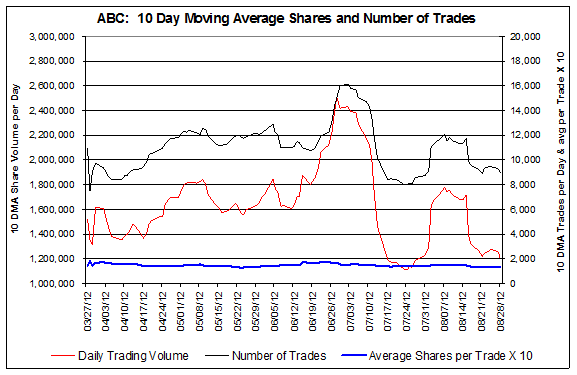
Showing in most relevant part that the share price has been performing best as the trading velocity has been decreasing from the elevated levels observed in June 2012.
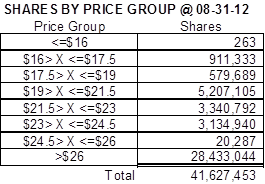
Lastly is an analysis of the shares held at a gain at various price points which graphic is:
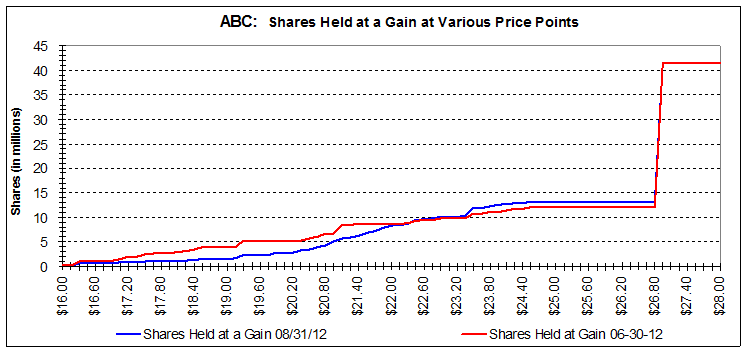
Which in this particular case reinforces the data contained in the price and age measurements and shows a large block of shares acquired at prices above $26.75 which skew the overall statistic. For the 14 million or so shares that have traded over the term of our engagement the crossover point is roughly $22.00 a share which is a reasonable support level for the shares which should approximate "fair value" under the broader market discounts being applied as of August 31, 2012, which discounts have since been lowered approximately 0. 2% as a result of the QE-3 announcement. The point here is that all things considered, ceteris paribus, ABC shares at prices below $22. 00 a share are suspect of being mispriced as opposed to $16.00 or $17.00 a share which clearly represented a mispricing.