Weekly Market without Missive
For the Period price support in XYZ shares was below average with the shares gaining AA cents per share or about B.B% to close the Period at $AA.AA per share.The clearing activity was interesting in that there were 50,000 shares delivered into DTC and a 100,000 share stock loan from State Street Bank to the old Bear Stearns of which the 50,000 share addition to DTC shares seems to have been sold pursuant to employee compensation.Speaking of share loans, the short interest reports were in for September 1, 2012, and as of that date the reported short interest in XYZ shares was A,AAA,AAA shares which is down nearly 230,000 shares from the B,BBB,BBB shares reported the 15 days prior.
The clearing chart for the Period was: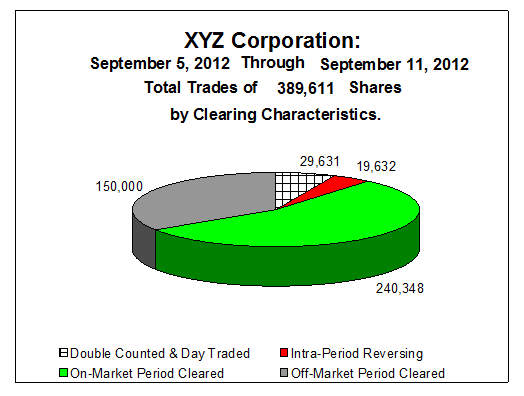
Showing mostly on-market cleared shares, 100,000 shares of off-market clearing and 50,000 shares of net delivery with less than 20,000 shares of reversing trades. So over the Period speculation was minimal and cleared shares approximated traded shares.
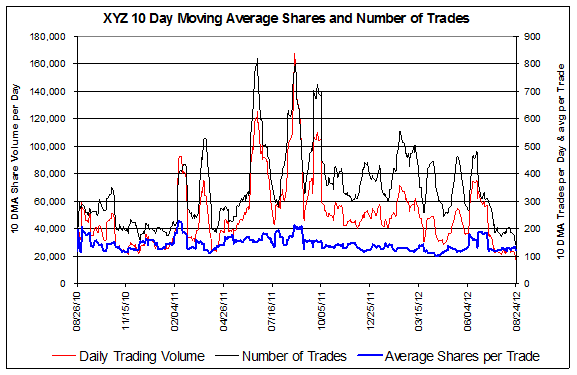
With the off market activity filtered out the trading graph was: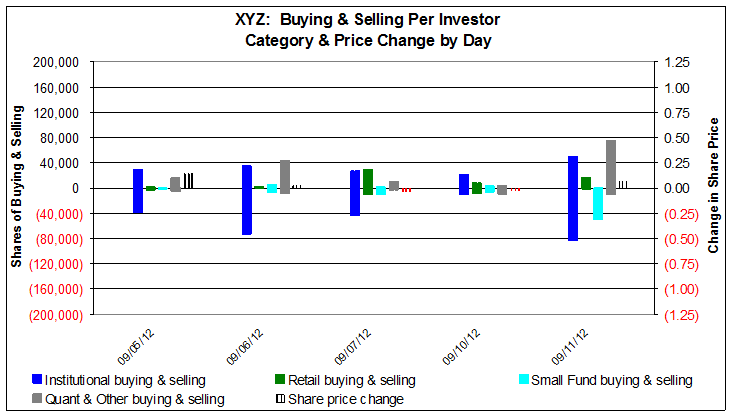
Showing mostly institutional and quant trading.
The net changes in position greater than 20,000 shares were:
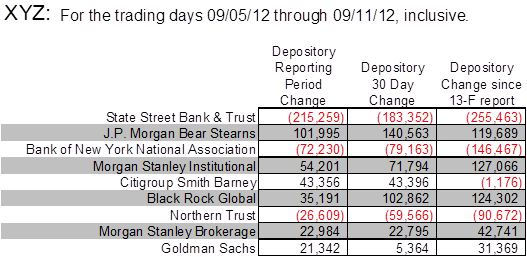
With the diminution at State being the 100,000 shares of loans to the old Bear Stearns and selling by Artisan and SSgA.The pickup at the old Bear Stearns was the share loan exclusive of the 50,000 shares received to DTC and sold.The sales at Bank New York appear to be sales from Dimensional Funds.The pickups at both subsidiaries of Morgan Stanley (one MSCO is the trading desk) and Smith Barney are new client buying at Frontier.The addition at BlackRock was buying by BlackRock.The selling out of Northern Trust was selling by Northern Trust of Connecticut, and the addition at Goldman is Goldman Asset taking a defensive position against what they probably thought would be a smaller QE-3.
As we mentioned last week we did the monthly compilations as of August 31, 2012, to serve as a baseline as we go into the post Labor Day through Thanksgiving trading Period which is usually one of the busiest of the year. The age price information as of that date was:
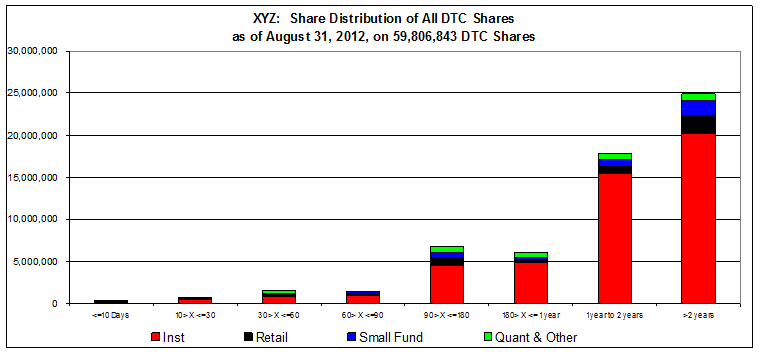
Which graph shows an increasing concentration at the long end of the range and a marked decrease in the shares that are routinely traded.
The basis tables were:
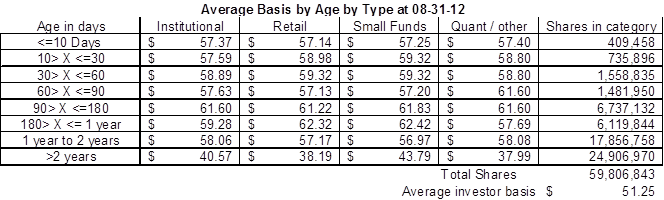
Showing higher priced shares in the long end and an average basis of $51.25 which was still an increase from the $50.88 a share at the end of June and the $51.06 a share at the end of July indicating that the reason the short end of the range has tightened up so much is only machines and low basis shares have been selling since the last earnings report.
Concerning the last earnings report the graph below is the discount analysis at 6.25% which was the overall discount prior to the last earnings report.
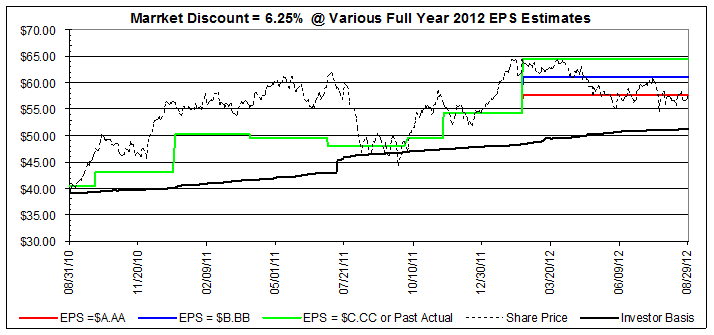
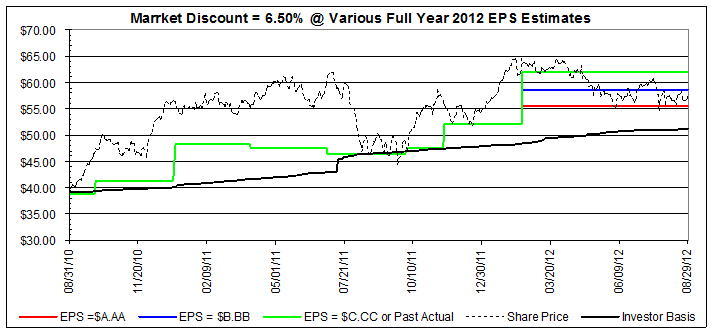
Please notice how on the day of the earnings the stock was rallying and just hitting the blue line which is the inferred value of the shares assuming $A.AA EPS at a discount of 6.25%.The also notice how the shares fell on the guidance revision.The same graph with an applied discount of 6.50% appears as:
Which comparison between the two graphs strongly suggests that the net effect of the last earnings report was that the market still assumes full year EPS of $A.AA per share but increased the risk discount by 0.25% based on the guidance revision which is logical given that the revised guidance concerned revenue.Also please recall that the revenue guidance revision was for XX million dollars which translated into a quarter percent on the overall discount and took the better part of two dollars a share off the price.We would also note that these numbers are already stale to some degree because the recently announced QE-3 seems to have been good for something approximating a quarter point on the overall market discount so the shares are back to $BB.BB a share as of this writing but not because of anything company specific but rather in response to changes in the macro environment.In any event now that we can quantify the effect of revisions to guidance we will put together a table that will estimate the likely effect of any further changes to guidance both revenue and full year EPS and forward that by the end of the quarter.
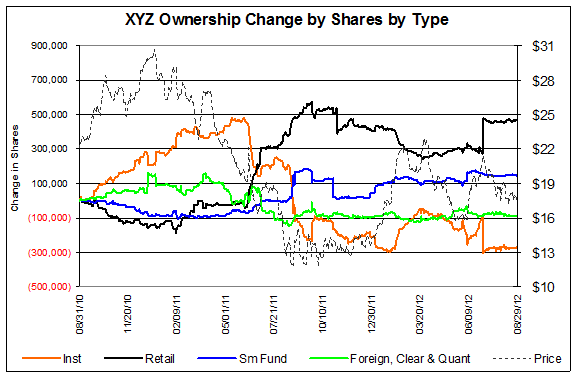
Lastly the liquidity and ownership change graphs are:
Which shows a declining trend for the full year and a rather sharp drop since the last earnings report as we went through the summer months.